In their excellent book Soccernomics, Simon Kuper and Stefan Szymanski identify three principal factors which affect the sporting performance of nations. Ranking countries in various sports including association football according to the results they obtained they authors find that these are largely dependent on population size, socioeconomic development and the experience nations had made in the same sport before. The logical link between these variables and sporting success is evident; the more people there are in a country, the more talented athlets there are (assuming that talent is normally distributed). Wealth on the other side allows communities and nations to invest into infrastructure, education and development programs which enhance players and athletes to exploit their full potential. The last point, experience, is self-evident.
Building on the logic that there are some important factors which explain past performances, one can take these variables and try to predict future ones. That is what I will demonstrate in this blog post. In order to perform the predictions, I collected data on all the teams which participated in one of the five last European championships (starting with the one in 1996). Data for population size and the level of development procede from the World Bank database. The experience gathered before the respective tournament was operationalized using countries' rank in the most recent FIFA World Raking (an imperfect measurement, I know, but I could not find anything better which is available for a reasonable period of time). In some cases (for instance the former Yugoslavian states) I had to look for information in Wikipedia or different publicly available statistics sources. This procedure left me with data on 80 nations (five tournaments with 16 participant nations each) which played 155 games among each other. Although technically speaking this is time-series cross-section modell, I considered all the observations to be independent from each other.
Subsequently, I ran a couple of logit regressions in order to assess the probability of each nation to reach quarter-finals, semi-finals or final and to win the tournament (due to the changed number of participants I was not able to model the round of last 16 probabilities using this rather simple method). Models were varied a little, given different weighting to the factors (including the fact that a country was the host or not). Finally averages from the different models were calculated. In a further step, I modeled win, draw and lose probabilities for each game of the group stage using the same methodology. Summing up the results, I was able to identify those nations which would most likely make it to the round of the last 16 and preceded in predicting the most likely outcomes of the final stages, which well be presented later on.
The following graphes show the respective probabilites of each country to reach the final stages of the tournament according to my models. The ranking of the nations differs a bit in the various graphs due to the fact that the factors obvioulsy play different roles in the prediction of different last rounds. Especially in later stages, factors such as luck and randomness should play a more pronounced role, weakening the predictive power of objective variables. Note that the numbers in these graphs also do not take into account opposition strength.
 |
| Graph 1 |
Graph 1 shows the respective probabilities of each nation to reach the quarter-finals. At the top we have Belgium, the best European team in the FIFA ranking. The following countries Portugal, Spain and Germany are also among the ten best nations in the ranking. Meanwhile, Turkey benefits from a quite high population size.
Interestingly, France has a quite low probability of surpassing the group stage and round of last 16 according to my predictions. This is most likely due to the bad performances of the hosts in the last tournaments. Neither in 2008 (Austria and Switzerland) nor in 2012 (Poland and Ukraine) did a host survive the earliest stage of the championship, which is why the value for France is most likely a bit biased.
As we can see, when it comes to the likelihood of reaching the semi-finals (graph 2), France displays the highest one. Hence, the model predicts a hard time for France in the earlier games but, if Les Bleus manage to survive them, a relatively easy quarter-final. On the other hand, smaller nations such as Belgium, Portugal and Austria would have a harder time from the round of last eight onwards, despite their good rank in the FIFA list.
 |
| Graph 2 |
If they make it to the semi-finals, the host squad is also very likely to reach the final game. Germany has however the highest possibility to stay in the tournament until July 10th, which is not very surprising given their high population size, level of development and classification in the FIFA ranking. Spain and Belgium are not far away from France (see graph 3).
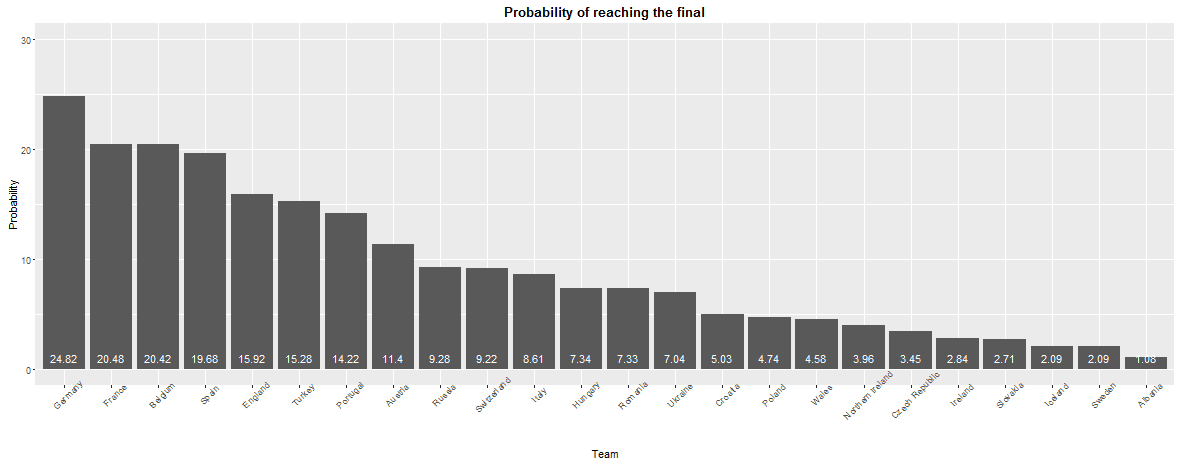 |
| Graph 3 |
The probability of a host win is in any case extremely low. France is in this case punished by the fact that I only have one host team in a final in my sample, which lost it (Portugal in 2004). Due to this low number of cases, the results for France should not be overestimated. In any case, the fact that Germany, Belgium, Spain and England appear on top of the list should mean something. Again, note the quite good foresight for Turkey (in graph 4).
 |
| Graph 4 |
All in all, the results are not too convincing given the low number of cases they are based on (although 80 is more than you would have when predicting a national league, it is still quite low). That is why I extended the sample by not looking on teams, but individual matches, and tried to predict the most likely outcome. As usual, the model rated the possibility of a draw very low (only one draw in 36 group stages games, vis-à-vis 27 draws in 120 group stage games in my sample). This is why I corrected (increased) the draw probability in games where predictions were close.
Summing up the points, goals scored and goals conceded which predicted my models, I ended up with the following list of teams which would make it to the final stages (see graph 5).
 | |
| Graph 5 |
Germany and France, the nations most likely to reach the final, are expected to win all three group stage games and qualify without any worries for the final stages. Likewise, Spain, Italy, England, Belgium and Austria are to finish their groups without losing a single game. On the other hand, Hungary, Wales, Poland and Ireland will depend on the results of the other two third-finishing nations (in my predictions, Switzerland and Croatia).
This prediction leaves me, following UEFA rules for the composition of the round of last 16 games, with the following matches:
- Romania vs. Ukraine
- Spain vs. Hungary
- England vs. Poland
- Austria vs. Italy
- Germany vs. Wales
- Belgium vs. Turkey
- France vs. Ireland
- Russia vs. Portugal
The only really tight prediction for these eight games according to my models is for Austria against Italy, in which the latter is 50.7% favorite. For all the other games, odds for the winner are at least 59% (in the case of Belgium) but rather between 70% and 90%.
Subsequently, the quarter-finals would be:
- Romania vs. Spain
- England vs. Italy
- Germany vs. Belgium
- France vs. Russia
Here again, we have one really tight game (Germany against Belgium with the probability of Germany winning only at 50.1%) and three relatively clear favourites (France, England and Spain).
Hence, the semifinals would see Spain facing and beating England (59 to 41) and France against Germany. The latter will be a close match with my models predicting a 52% chance of reaching the final for the host team.
In the final, on average my models see Spain as favourite (at around 56%). Therefore, one could expect the Iberains to defend their title. Once again.
Keine Kommentare:
Kommentar veröffentlichen